- A Proximity Marketing Company - Beacons | NFC | QR Codes")
-

QR CODES -
PRODUCT FREE
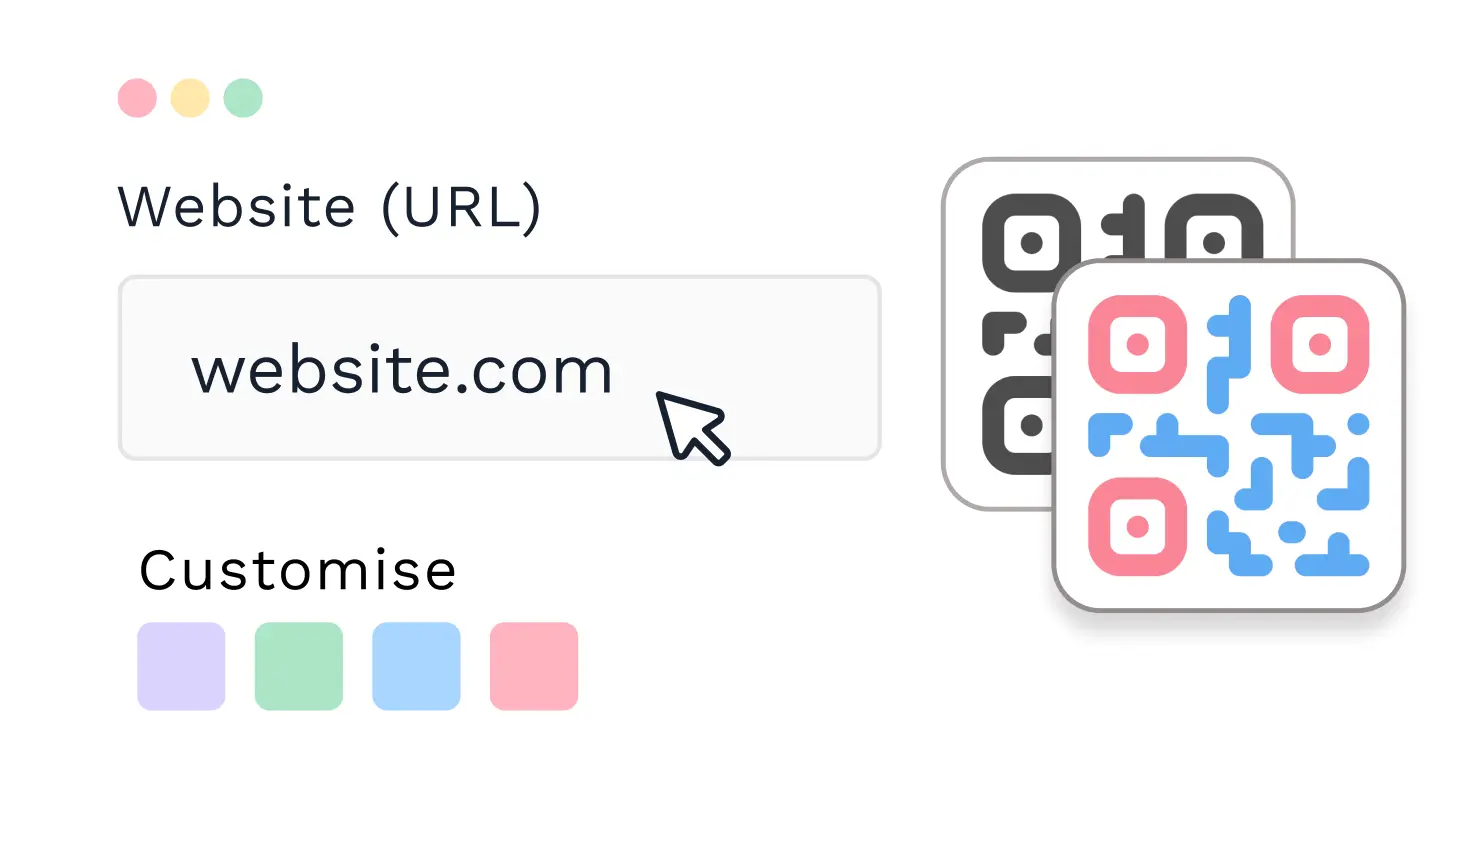
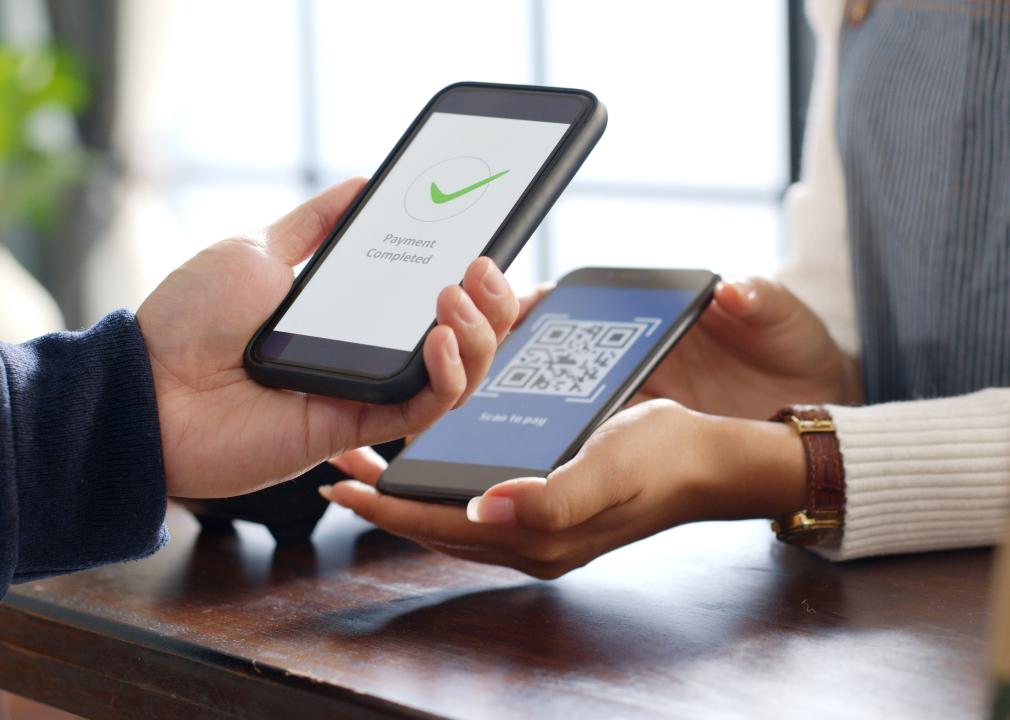
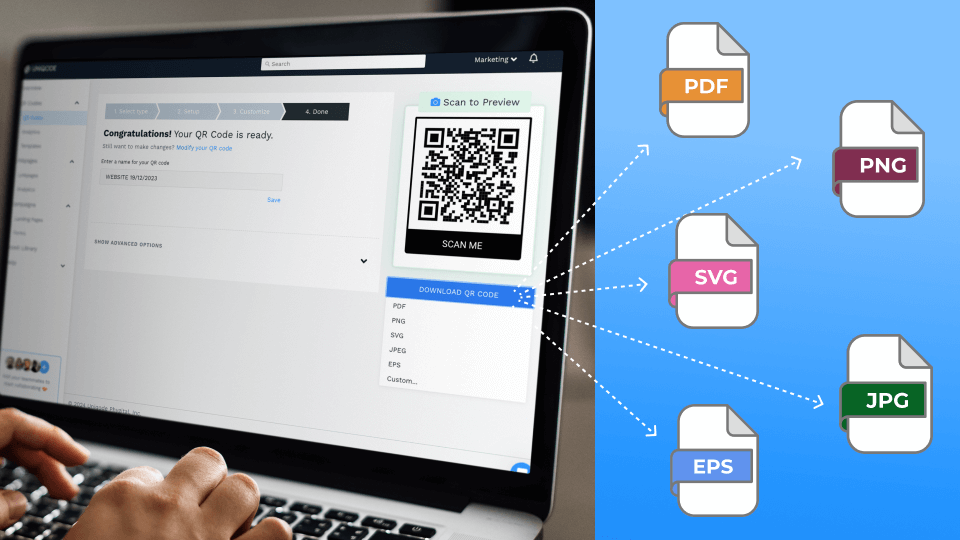
QR Code Generator
Create custom QR Codes for every use case
-

Dynamic QR Code Generator
-
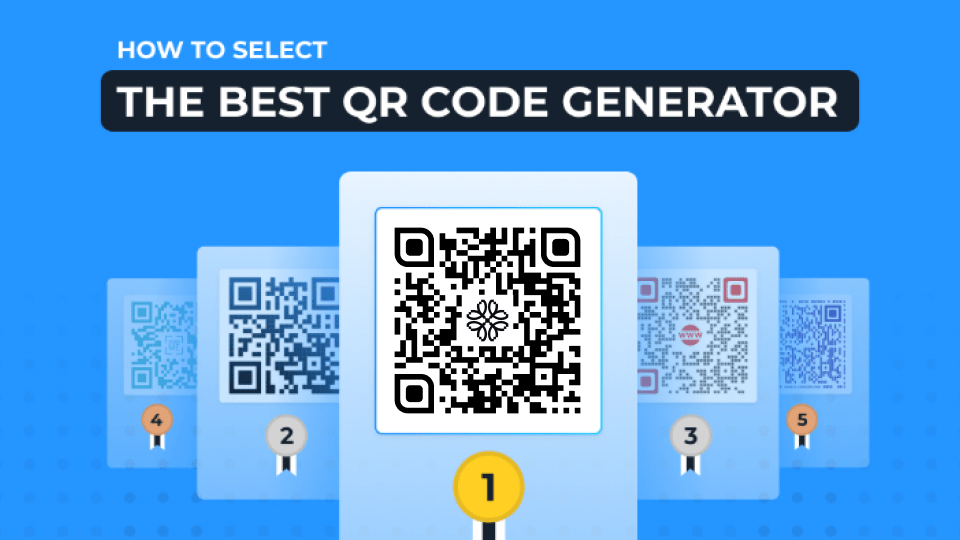
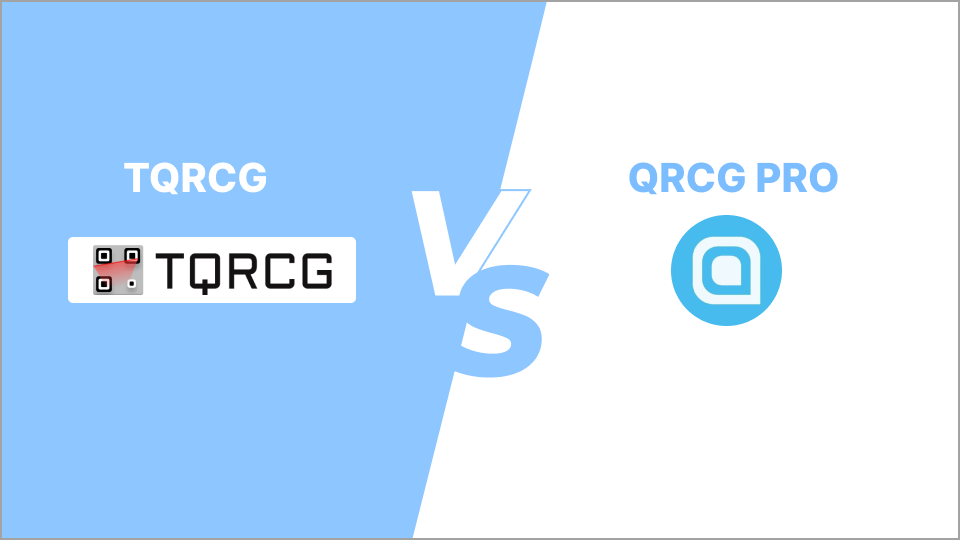
Choosing the Best QR Code Generator
-

QR Code Tracking
-

QR Code API
-
GET STARTED
Select a template to continue
-
-
 DIGITAL BUSINESS CARDS
-
PRODUCT POPULAR
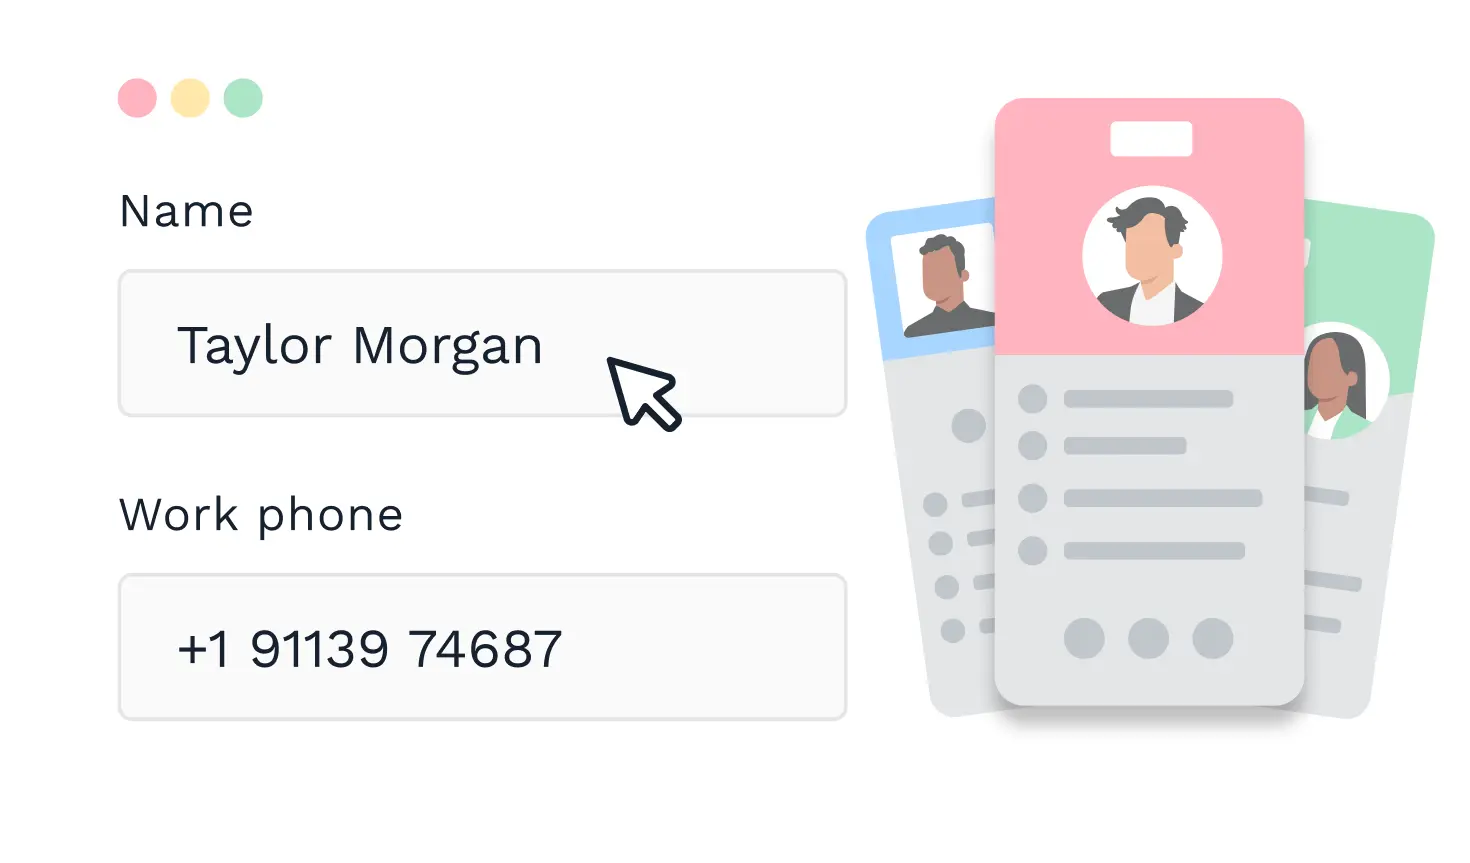
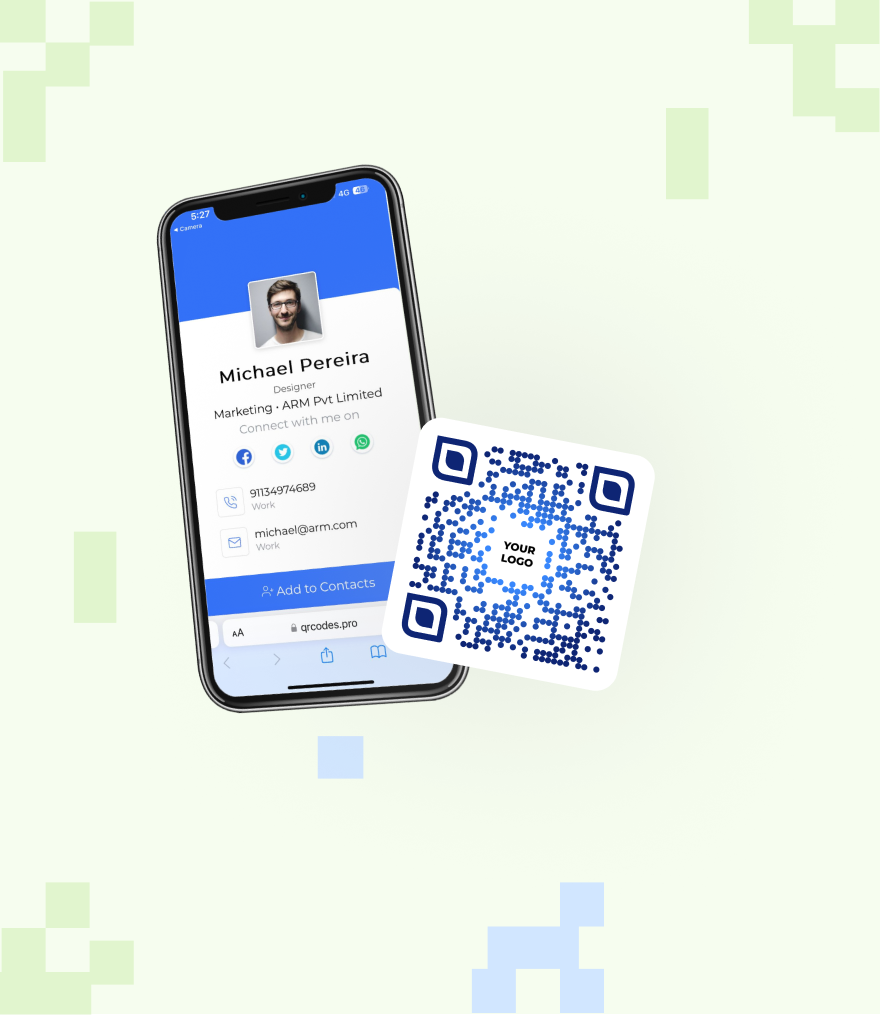
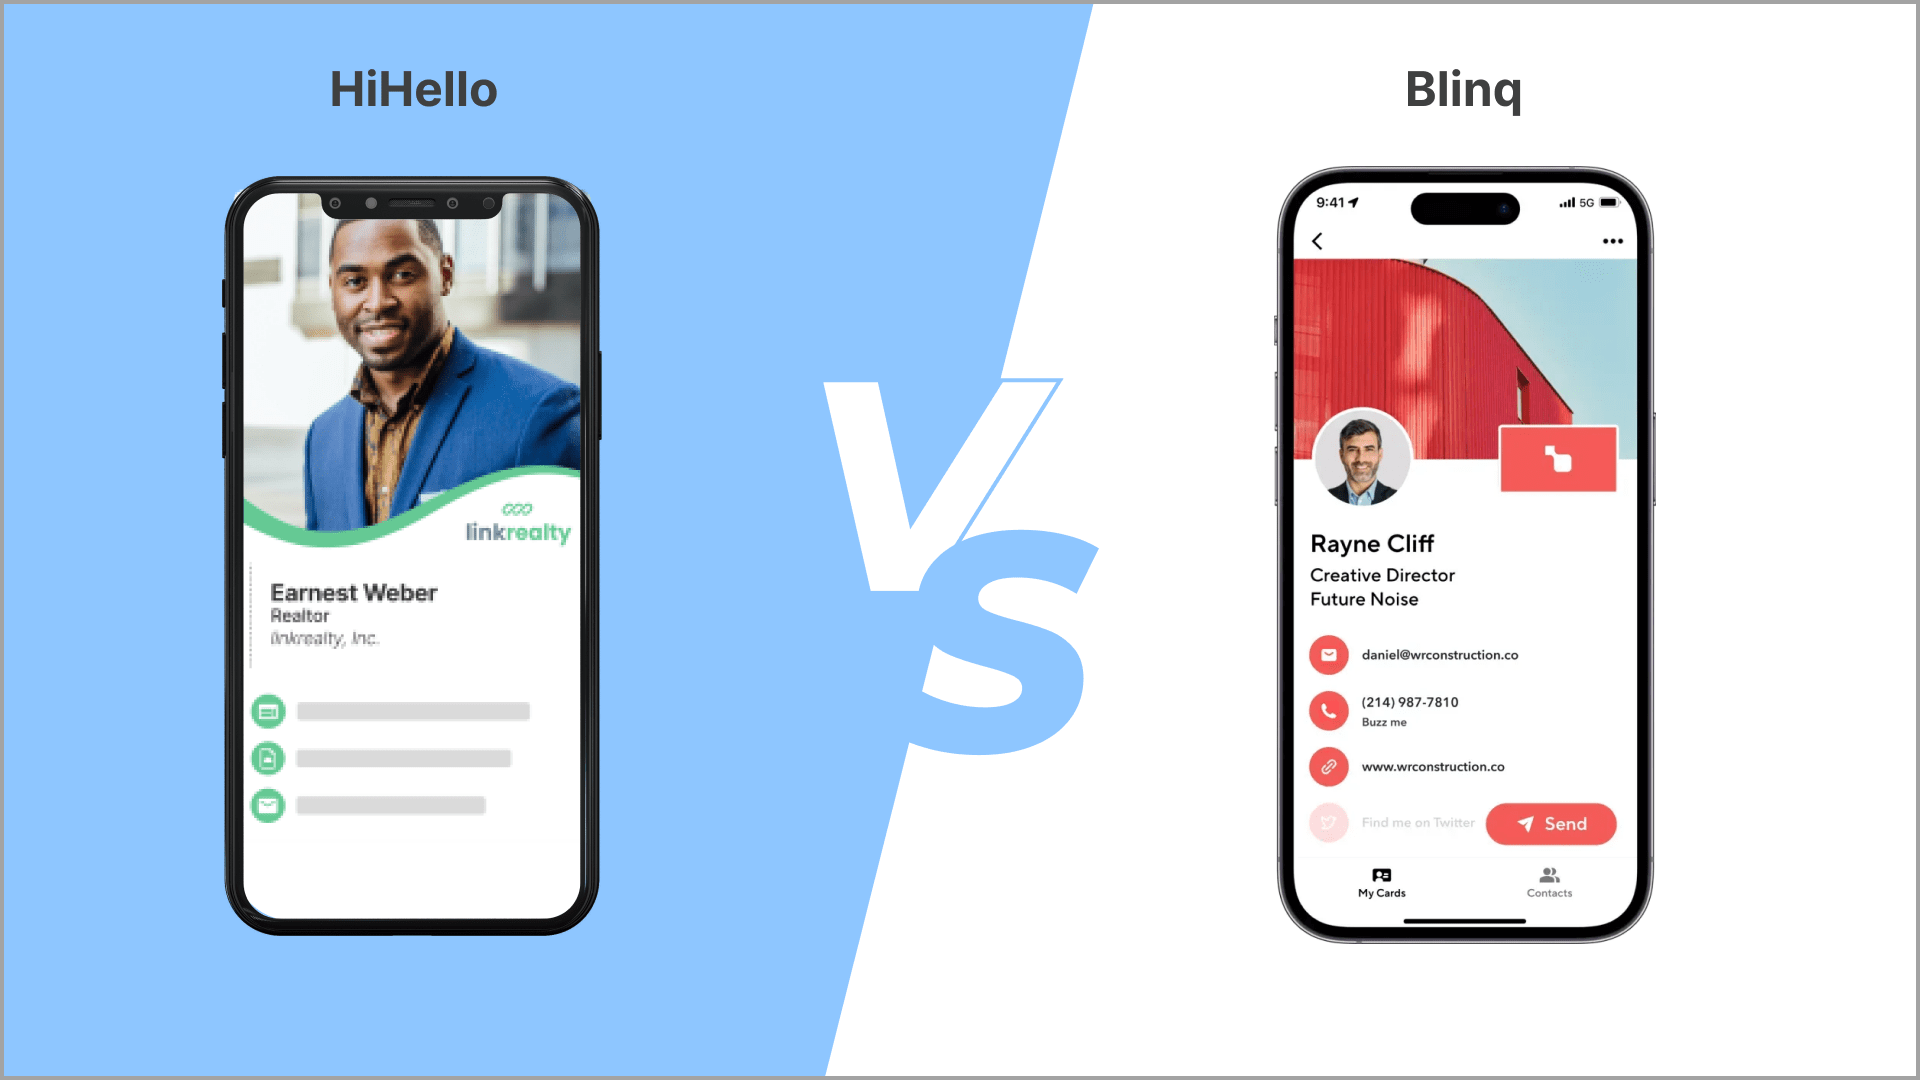
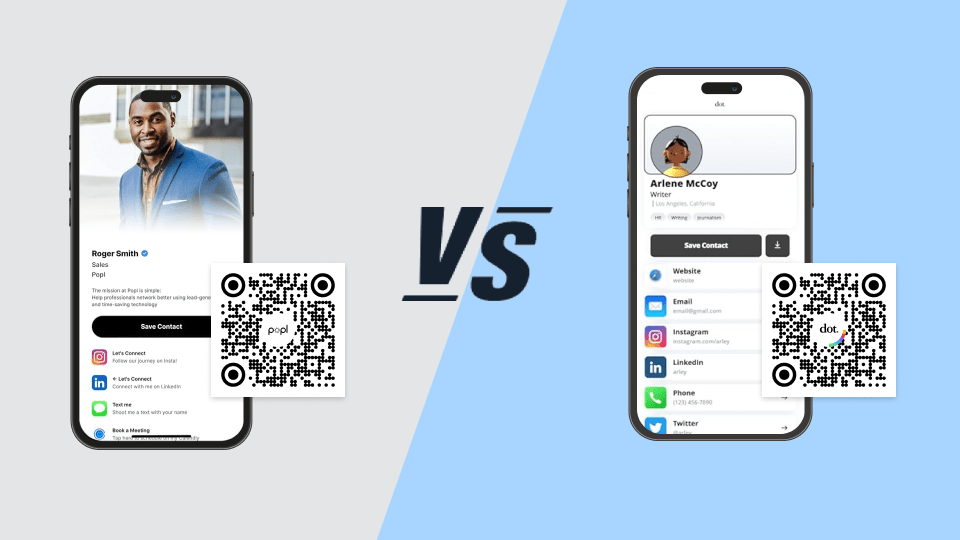
Digital Business Cards
Measure your networking with digital business cards
-

All About Digital Business Cards
-
Apple Wallet Business Cards
-

Physical Vs Digital Business Cards
-
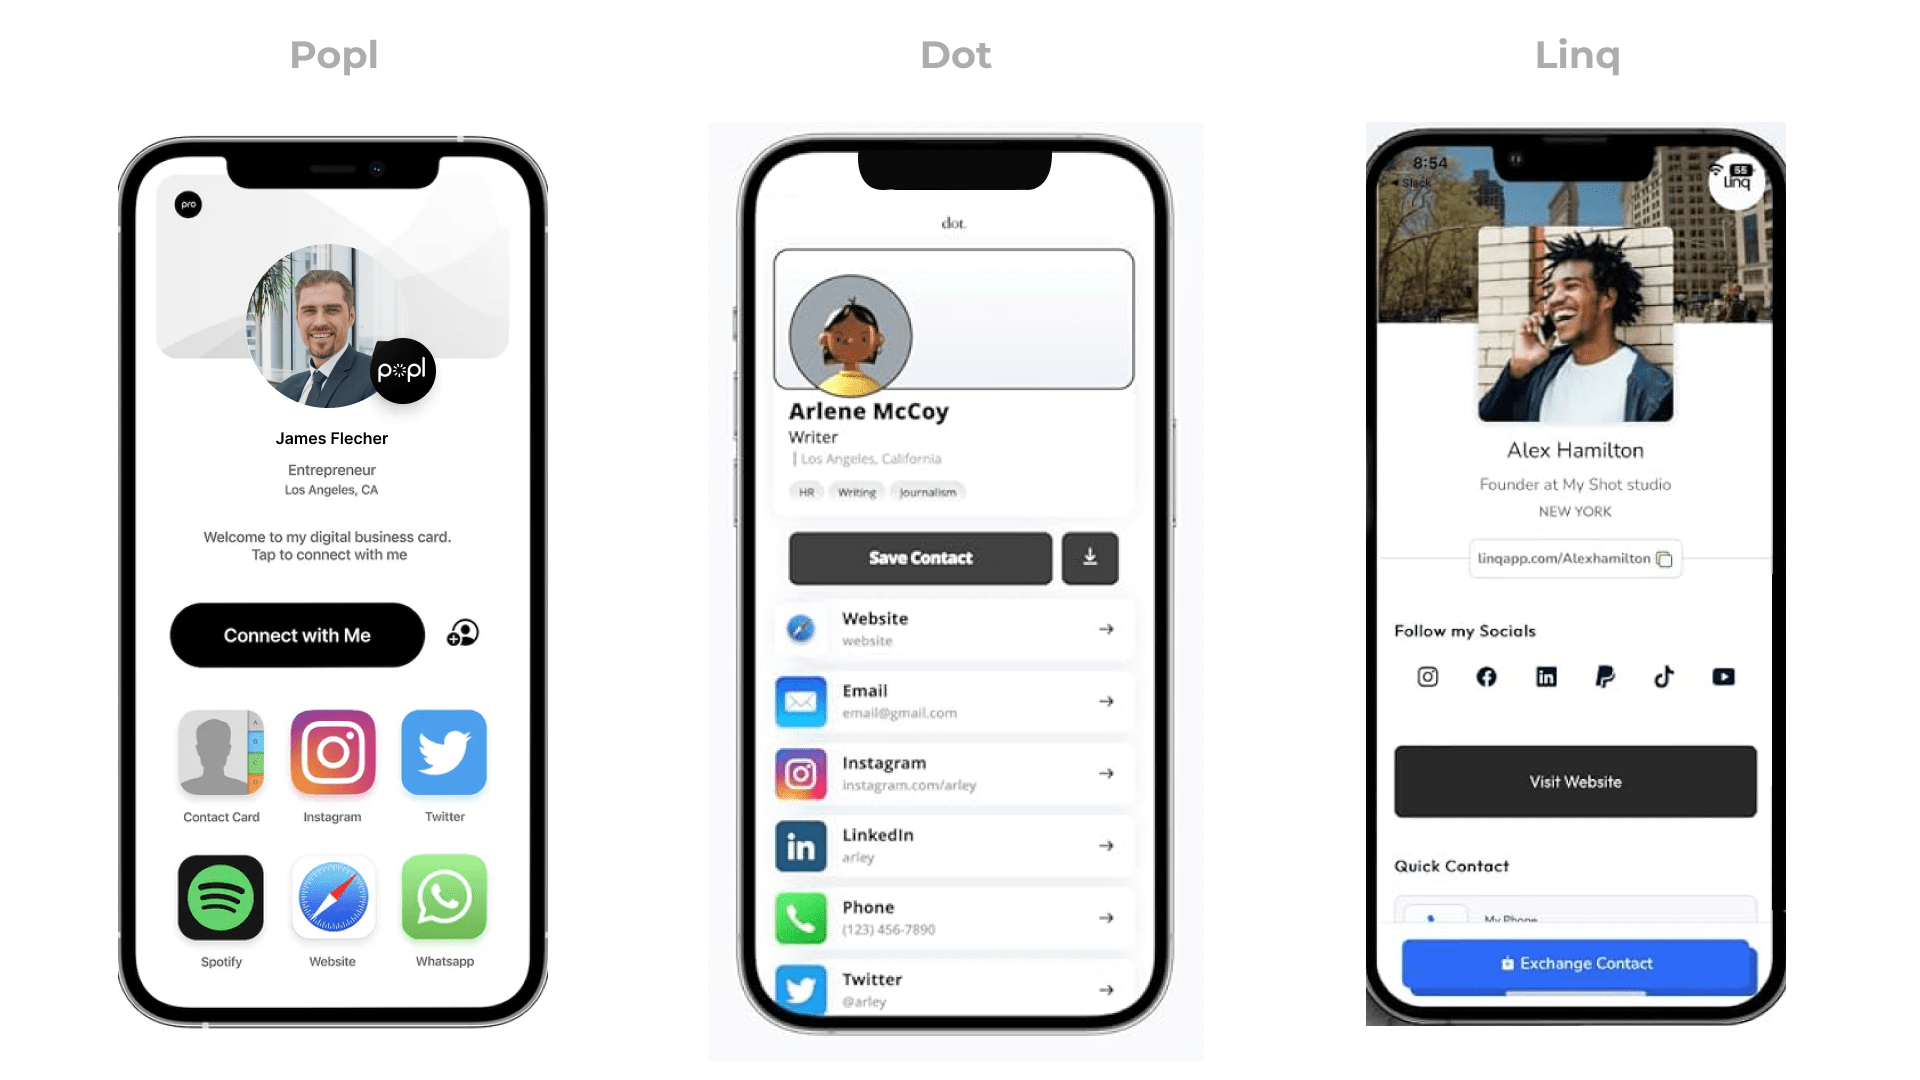
Choosing The Best Digital Business Card Solution
-
GET STARTED
Select a template to continue
-
-
 SOLUTIONS
-
BY INDUSTRY
-
BY USE CASE
-
BY BUSINESS
-
-
 LEARN
LEARN
-

A powerful and easy solution for our business.
Uniqode’s solution has made our lives a lot easier.

MARCELO YANEZ
PRODUCT MANAGER,
NESTLE
Read all customer stories
-
 PRICING
-
 DEMO
DEMO